
Analyzing Skewed Distributions
Transformations to obtain Normal Distribution Characteristics
We use different data analyzing techniques to extract meaningful information. These techniques could vary from statistical methods, machine learning methods etc. In some cases we assume the normal distribution of data but in reality the data we obtain may not possess these ideal characteristics that we assume. In such cases some sought of a transformation is required to convert the real data to a normal distribution so that we could carry out the analysis. The practical distributions could be in the forms such as Right skewed, Left skewed , or with a couple of peaks. This article is mainly focussing on skewed distributions, and methods to convert them to a normal distribution.
Lets identify a couple of methods which can be used to transform the actual distributions to a more analyzable normal distribution.
- Box-Cox Transformations
- Log Transformations
- Skewed Normal Distribution equations
1. Box - Cox Transformations
Box - Cox transformations relate to the different functions obtained by using different Lambda values of the function T(lambda) = (x^lambda - 1 ) / lambda In this approach we use the above equation to transform the data and thus should test whether the transformed distribution possess the normal characteristics we look for. Since we obtain a set of transformed distributions we need a method which would enable us to choose the best transform. This decision process can be carried out in couple of methods. Some of the methods are discussed towards the end of this article.
Resources - http://www.itl.nist.gov/div898/handbook/eda/section3/boxcoxno.htm
2.Log Transformations
The log transform is a popular transform to convert a distribution to a normal distribution and most of the finance data are log normally distributed. i.e the log value of data is normally distributed. The base of the log value can be selected appropriately as its sole effect would only be on the magnitude of the transformation. The main drawback of this transform across handling negative data values. In order to overcome these issues we could try to do the following, it should be noted that these will not be fully accurate, depending on the data set an appropriate method should be selected.
- Take the data as two different distributions one for the positive values and another for the negatives and analyze it separately using the log transform.
- Substitute the negative value with a different appropriate value. Ex : Substitute by the smallest non negative value divided by two.
Resources - https://www.r-statistics.com/2013/05/log-transformations-for-skewed-and-wide- distributions-from-practical-data-science-with-r/
Example
I simulated some results of the above methods. The Matlab Codes i developed for the simulation can be obtained from here.
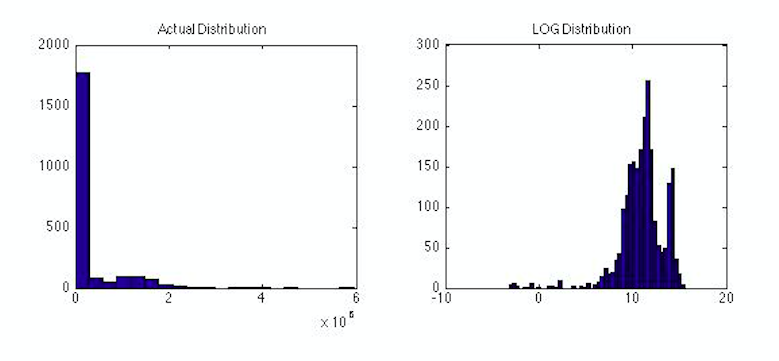
The following graphs relate to the distributions obtained from the Box-Cox transformed and the log transform. You can identify that the Actual transform does not possess any normal behavior thus cannot be analyzed using conventional methods. Hence we are trying to transform the actual distribution.
We when we have applied the log transformation the distribution has obtained features of a normal distribution.
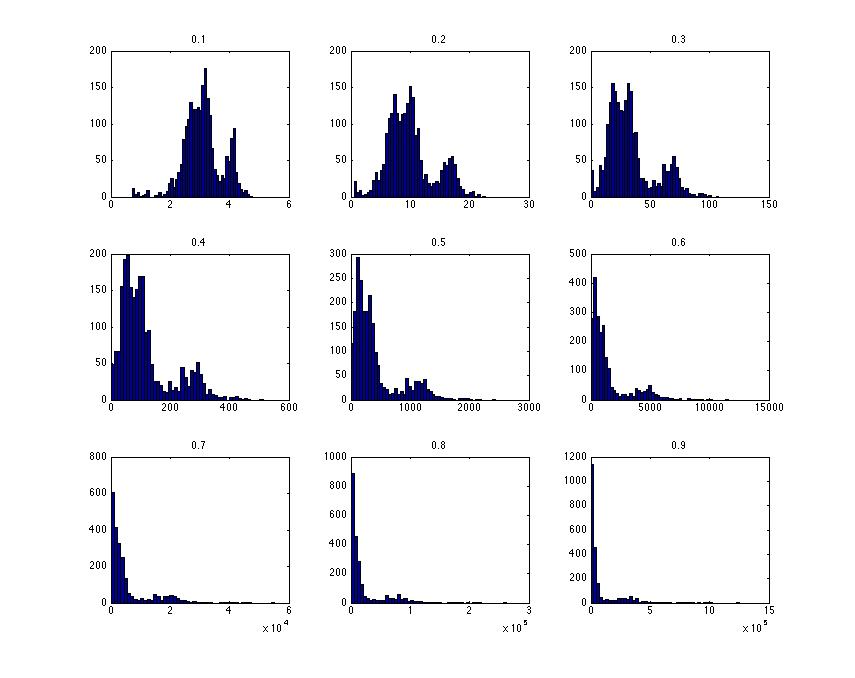
The following two graphs shows the instances where the Box-Cox transformation for selected values of the Lambda Parameter. The Lambda parameter is shown above each graph and in some cases the distributions have neared a normal distribution. The next important feature would be in selecting the best transformed distribution which is discussed in the following section.
The following graphs are related to the negative value ranges of the Lambda Parameter. In this scenario only lambda = - 0.9 obtains somewhat of normal distribution. it should be noted that there aren’t any fixed ranges that we can try out, rather it would depend on the distribution of data which we are analyzing.

Choosing the best Transform for the Distribution
We have identified Box-Cox Transforms and the Log Transforms above and we need to identify the most suitable transform to apply for the particular data set. This can be done be analyzing the factors such as the skewness and the kurtosis of the new distributions.
Skewness

The Skewness of a distribution would equal to zero if it is a normal distribution and positive or negative depending on positive skewed and negative skewed nature. Thus by considering the absolute value of skewness we can compare the normal behaviour of the distributions.
Resource - Skewness : https://en.wikipedia.org/wiki/Skewness
Kurtosis

Kurtosis also can be used in a similar manner to differentiate between the distributions. Both these factors are directly linked to the Normal behaviour of the distribution. A thorough understanding on the kurtosis characteristic could be obtained by using the following link.
Resource - Kurtosis : http://www.itl.nist.gov/div898/handbook/eda/section3/eda35b.htm
JB Test

Also in addition to the above identified methods the JB Test which takes both the skewness and kurtosis can be identified as a far superior method to differentiate between the derived distributions. The interpretation of the values of the JB Test can be understood by the following link.
Resource : https://en.wikipedia.org/wiki/Jarque%E2%80%93Bera_test
It is important to note that the methods we choose for the identification of normality could differ based on the nature of the data set, thus through testing with above methods would enable the selection of the best methodology. Furthermore there are many tests which check the normality of the distributions.
Resource : http://webspace.ship.edu/pgmarr/Geo441/Lectures/Lec%205%20- %20Normality%20Testing.pdf
3.Skewed Normal Distribution equations
Skewed Normal Distribution equations have been derived using the skewness into account. Hence these equations can be used for analyzing a skewed data sets. Mean, standard deviation figures have been derived accounting for the skew nature, although it should be noted that in order to derive the equations we need to calculate a couple of parameters namely the location, shape and scale parameters. There are no straight forward methods for calculation hence numerical methods much be used for the calculations.This is a somewhat of a different method which can be tried compared to the above two methods.
I prepared this article since i couldn’t find any article which links these methods in analyzing a skewed distribution and all the related . Thus i had to go through a lot of online material to get a good understanding on the entire picture of handling skewed distributions. I have mentioned all the online material which i have used and it should be noted there are many ways mentioned in those links and this effort was just to help out an initial understanding on the topic and to merge all the related methods to one article to make it easy for person who is new to the topic. A special thanks goes to Varuna Jayasiri & Chethiya Abeysinghe for the guidance i received while working in this area of mathematics. Please be kind enough to point out any corrections and new information related to the topic.
Resources - https://en.wikipedia.org/wiki/Skew_normal_distribution